

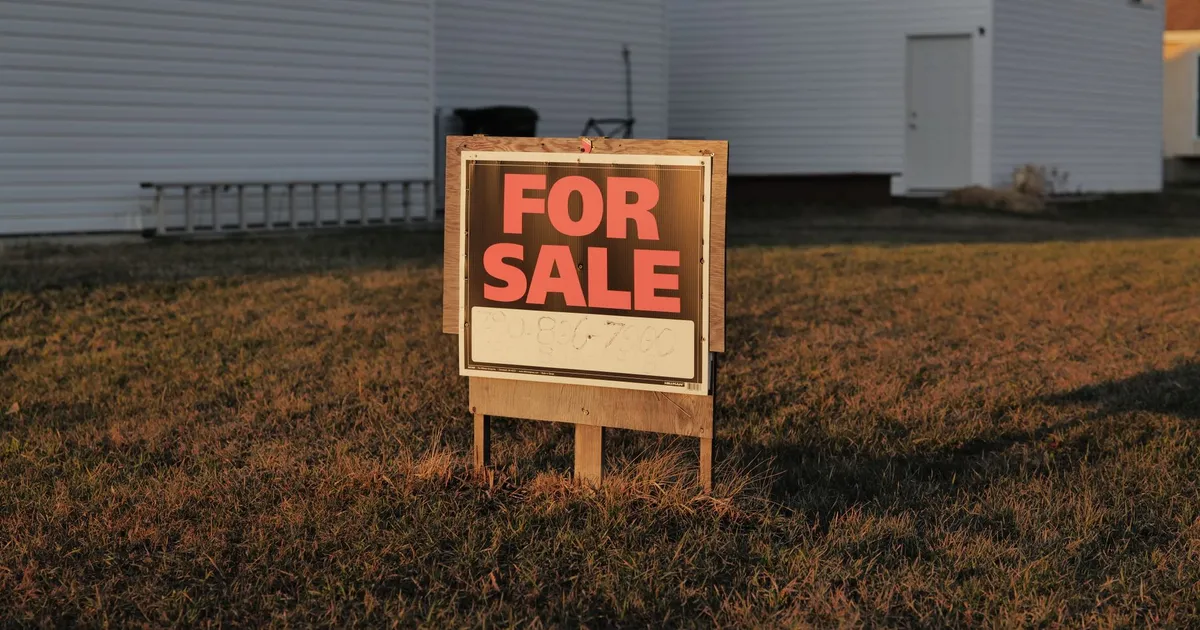
The national house price figure has become close to useless. It blends two different property cycles, one sliding in the North Island and one still climbing in the south, into a single number that describes almost nobody’s actual position. Stuff’s latest list of suburbs where values soared while the nation plummeted is the latest reminder. The data underneath it carries a sharper message for lenders, developers and retailers.
A mild national dip hides a deep split
The ministry’s new House Price Index put the national annual change at -0.8% to June 2026. Inside that figure, Auckland fell 3.0% and Wellington fell 4.5%, while Canterbury rose 4.1%, Otago rose 4.3% and Southland jumped 8.6%.
The ministry’s own June quarter housing market update describes North Island prices unwinding pandemic gains back towards 2020 levels on weaker demand and more supply. South Island prices, by contrast, sit 2-5% above their COVID peaks, supported by migration and a stronger local economy.
QV’s index told the same story. National values fell 0.4% in the June quarter, with Auckland down 0.7%, Wellington down 1% and Christchurch ahead of both. QV spokesperson Simon Petersen says “the national average only tells part of the story“.
Down at the suburb level, the gap gets wider
Cotality’s figures for the three months to September show how broad the softening has become. Almost 80% of the 1,422 suburbs it tracks recorded falling standalone values, with 750 down more than 1%. Cotality’s Kelvin Davidson calls it “broad-based sluggishness”.
Townhouses are taking the worst of it. Values fell in 74% of suburbs, and 22 suburbs dropped more than 5%, led by Beachlands (-11.2%) and Kelburn (-10.7%), then Mangere, Wiri and Kingsland, all down more than 9%. Meanwhile standalone homes in Pukenui rose 5.1% and Makarewa 2.7%.
The annual picture is starker still. Over the year to June, Orepuki in Southland rose 20.9% to $453,208 and Fox Glacier 20.1%, followed by Lorneville, Wallacetown and Te Anau. At the other end, Auckland dominated, with Ti Point down 9.7% and Wiri down 7.4% to $786,723.
None of this is a sudden shift. Back in 2024, Corelogic, Cotality’s predecessor, found cheaper suburbs had been more resilient, with Davidson saying then that “those areas towards the cheaper end of the spectrum held up better“. The pattern has simply hardened into a north-south divide.
Fewer sales, more noise
The Reserve Bank’s latest housing series shows June quarter sales of 21,481, down from 24,745 a year earlier, a 13% drop in volume. With fewer transactions, where the remaining buyers are active does more to shape the headline index than any genuine national trend. On a $1.66 trillion housing stock, small compositional shifts move large sums of wealth.
The good news is that the tools to see through averages are improving. The ministry’s property and sales dashboard, launched in June, publishes local board and territorial authority data back to 1980, explicitly to expose trends national averages obscure. Until now, that granularity mostly sat behind private providers.
Where the business risk actually sits
Three implications stand out.
Collateral is uneven. A loan book weighted towards Auckland and Wellington townhouses sits on materially softer security than a sub-1% national fall implies. A 10% drop in a year can wipe out a first-home buyer’s deposit and push loan-to-value ratios into territory banks will price, and scrutinise, at refinancing.
Development feasibility is now suburb by suburb. The sharpest townhouse falls are in exactly the infill and medium-density markets, Mangere, Wiri, Kingsland, that smaller developers have targeted. Falling end values squeeze presales and exit margins while build costs stay sticky. Projects pencilled on 2024 assumptions need re-running.
The wealth effect is regional. Southland and Otago households sitting on equity gains of 4-9% are a different customer to Wellington households nursing a 4.5% annual loss. Retailers, hospitality operators and tradies allocating marketing or staff should treat the south as its own market, not a rounding error.
Stop reading the national number
Sales volumes remain thin, buyers retain bargaining power, and the forces splitting the market, a stronger primary sector in the south and a softer economy in the main North Island centres, show no sign of reversing soon. Expect the divergence to persist into 2027. For anyone lending, building or selling into housing-linked demand, the question is no longer what the market is doing. It is which market you are actually in.
Sources
- Stuff: The top 10 spots where house values soared, while the nation plummeted (2026-10-18)
- RNZ: Suburbs where house prices are rising and falling fastest (2026-09-09)
- The Post: NZ house prices by suburb – the growing divide (2026-06-09)
- RNZ: Corelogic data shows the New Zealand suburbs where property prices are still rising (2024-09-12)
- Ministry for Cities, Environment, Regions and Transport: House Price Index (2026-08-12)
- Ministry for Cities, Environment, Regions and Transport: Housing Market Update, June quarter 2026 (2026-08)
- Ministry for Cities, Environment, Regions and Transport: New dashboard opens up property and sales trends across New Zealand (2026-06-18)
- QV: QV House Price Index – patchwork property market grows more pronounced (2026-07-08)
Join the discussion
Add useful context, ask a good question, or challenge an idea — keep it specific and respectful.