

New Zealand now spends 55.9 days per year under declared states of emergency, up from just 13.4 days a decade earlier. In 2025 alone, the total hit 72 days, the third-highest annual figure in 25 years. Eighty percent of those emergencies were for severe weather or flooding.
The Whanganui and Ruapehu emergencies are not freak events. They are the new normal. And for business owners in exposed regions, the consequences extend well beyond sandbagged doorways.
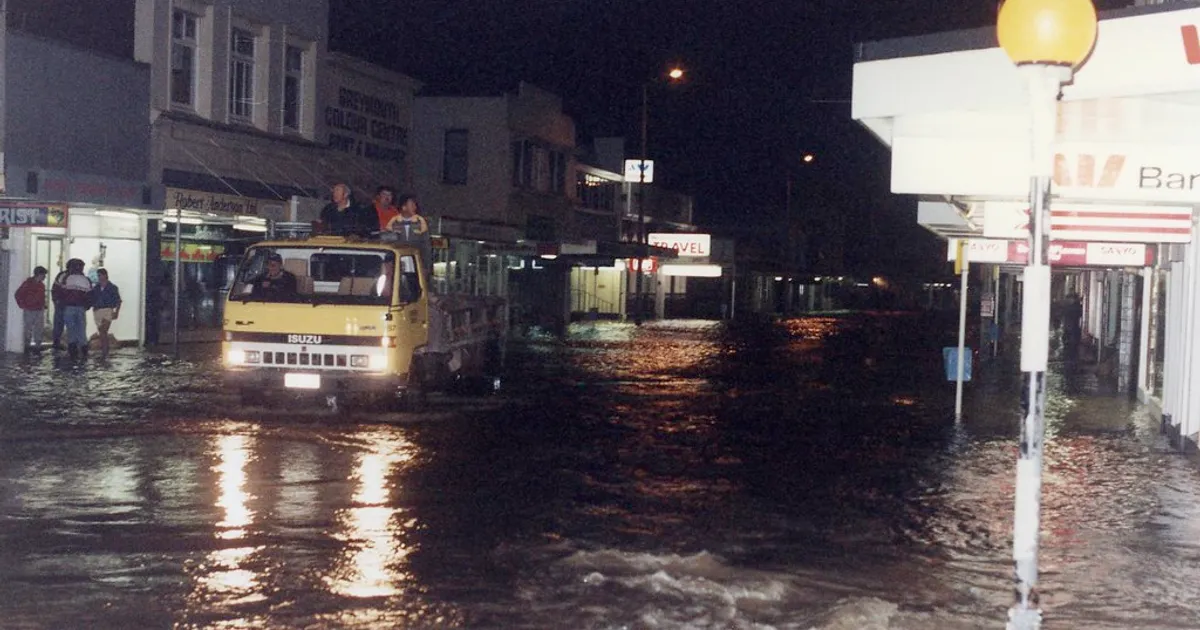
Whanganui’s numbers are worse than most people realise
Horizons Regional Council completed an 18-month flood vulnerability assessment covering 52 towns across the Manawatu-Whanganui region. Whanganui ranked second most vulnerable, behind Palmerston North. Of the city’s 34,005 buildings, 8,017 are exposed to flooding. In a one-in-200-year event under current conditions, 4,319 buildings would be damaged at a reinstatement cost of $394.4 million. Under 3C of warming, that figure climbs to $976 million across 9,522 buildings.
For context, the 2015 Whanganui flood, classified as a one-in-130-year event, cost $120 million in recovery. Roading repairs alone ran to $40 million.
Horizons councillor Alan Taylor put it plainly: “Society’s willingness to fund what the future is likely to throw at us is also an unknown, yet highly likely to be an underestimation of what is necessary.”
Insurers have already repriced, and they are not done
The insurance industry absorbed over $1 billion in claims from the January-February 2023 North Island floods and Cyclone Gabrielle. IAG alone processed 51,000 claims. The average house insurance claim cost jumped from roughly $10,000 in 2018 to over $60,000 by 2023.
Industry-wide, the commercial material damage loss ratio hit 132.91% in 2023, meaning insurers paid out $1.33 for every dollar of premium collected. By 2024 that had recovered to 57.87%, but the recovery came through repricing, not reduced risk. Domestic buildings and contents premiums rose to $3.16 billion in 2024 from $2.74 billion the year before.
Treasury’s residential insurance data collection, conducted across 3,510 profiles nationally, found premiums rose 8.7% in just six months to October 2024. For high flood risk profiles, online insurance availability dropped four percentage points to 89%. That gap will only widen as events keep stacking up.
The national exposure is staggering
Earth Sciences NZ research led by Dr Emily Lane puts the scale in perspective: more than 750,000 people live in areas vulnerable to one-in-100-year rainfall flooding. Some $235 billion in building assets are exposed today, rising to $288 billion under 3C warming. That includes 26,800 km of roads and 21% of national grid sites.
Academic researchers from Otago, Victoria and Waikato universities found around 500,000 buildings valued at more than $145 billion are already exposed to extreme flooding near rivers and coasts. Their finding is damning: the same systemic failures have been identified in post-disaster reviews since 1986 without being fixed. They describe a “levee effect” where engineered protections encourage further development behind them, increasing exposure when those protections fail.
The insurance industry is telling government to act or lose coverage
ICNZ chief executive Kris Faafoi has been unusually direct. “Keeping insurance accessible requires of us, led by government, to step up and reduce the underlying risk,” he said. The cost-benefit case is clear: the Awanui Flood Protection Scheme in Kaitaia cost $15 million to build and has already avoided an estimated $50 million in damage. The Taradale stop bank improvements cost $4 million and are assessed as preventing billions in losses across 10,000 properties.
Faafoi’s message ahead of the 2026 election is pointed: “Whoever forms the next government will need to grasp the scale of this challenge. They will also need the support of whoever forms the next opposition.”
Meanwhile, the Natural Hazards Commission logged more than 800 claims in the first two months of 2026 alone. Events are arriving faster than the claims resolution cycle can clear them.
What this means for business in exposed regions
The cascade is predictable: rising premiums, shrinking insurer competition, declining asset values for flood-prone commercial property, and transport disruption that outlasts the emergency itself. The Whangarei experience in January 2026 saw road closures lasting 8 to 14 weeks, creating sustained supply chain problems well beyond the initial event.
Businesses making long-term investment decisions in flood-exposed regions are doing so against a background of known, unaddressed risk. The data exists. The modelling exists. The insurance industry is saying plainly that coverage depends on government action. What does not yet exist is the political will to spend $15 million on a flood scheme today instead of $120 million on recovery tomorrow.
Sources
- Insurance Business Mag: Councils concerned as communities spend longer under emergencies (2025)
- NZ Herald: Whanganui flood risk – New Horizons report predicts vulnerability in one-in-200-year event (2025)
- RNZ: New flood data shows where Manawatu-Whanganui most vulnerable (2025)
- RNZ: Flood recovery cost now at $120m (2015)
- ICNZ Market Data – 12 months to December 2024 (2025)
- Treasury: Insurance Data Collection Report November 2024 (2025)
- Insurance Business Mag: Nationwide research highlights growing flood risk in New Zealand (2025)
- Insurance Business Mag: NZ stuck in disaster inertia cycle, researchers warn (2025)
- Insurance Business Mag: ICNZ seeks faster action on natural hazard resilience (2025)
- ICNZ: Act now or pay later – Hazard resilience policies a must in the 26 election (2025)
- Insurance Business Mag: NHC logs surge of early-2026 natural hazard claims (2026)
- Insurance Business Mag: Whangarei ends district emergency (2026)